

LEARN | Module 8
Prognosis
Prognosis can be defined as a prediction of the future course of a disease. Prognostic information allows clinicians to:
Inform patients about the likely course of the disease
Make treatment decisions
Prognostic factors differ from risk factors in that they influence the outcome of a disease, once the disease has already been established.
As always, please post any questions, comments or suggestions in the Disqus comment feed at the bottom of the module!
Video
Please view the following video and then read below for further information.
Study Types for investigating Prognosis
Randomised Controlled Trials
When a control group receives placebo, information on the natural history of the disease can be gathered. By following up the intervention group, we can determine if there is a difference in prognosis.
Limitations:
Insufficient follow-up – follow up is often limited to a relatively short time frame
External validity – patients taking part in these studies are often highly selected and hence not representative of patients you may see in practice
Placebo effect – both placebo effect and other factors related to participation in the trial may alter the natural history of the disease
Cohort Studies
When examining risk, cohort studies:
Form groups based upon exposure to a risk-factor
Measure outcome – rates of a particular disease
When examining prognosis, cohort studies:
Form groups based upon exposure to a disease and record baseline characteristics
Measure outcome – rates of particular events
This allows the investigators to determine which baseline characteristics are prognostic factors. Note the importance difference from case-control studies – we are still beginning with an exposure and then measuring an outcome (moving forward in time).
Of course, the original cohort of patients must be at a similar point in the natural history of their disease. If a 49-year-old patient with stage 1A Hodgkin's lymphoma survives for 10 years longer than a 24-year-old patient with stage 3B Hodgkin's lymphoma, we can not say that older age is a negative prognostic factor because clearly the second patient's disease had already progressed further.
Bias
Sampling bias – are there any factors that may have affected why particular patients were part of a particular cohort, and does the sample differ systematically from those patients who you wish to apply the results to?
Incomplete follow-up – if those that are lost to follow-up are systemically different from those in whom follow-up is complete (patients severely affected by their disease are less able to attend follow up clinics), or if the duration of follow-up is not long enough to observe all important outcomes.
Non-response bias – when individuals are followed up with surveys, there may be systematic differences between those who respond to the surveys and those who do not.
To examine the potential impact of losses to follow-up, a sensitivity analysis can be performed. This involves considering:
A worst-case scenario (in which all those lost to follow-up develop the negative outcome)
A best-case scenario (in which all those lost to follow-up do not develop the negative outcome)
This gives us a range of rates to consider from worst to best case.
Multivariate analysis
In every disease, there are a wide range of prognostic factors that all interact. In order to pick apart in what way each individual prognostic factor is influencing prognosis, a multivariate analysis should be performed. This allows us to determine whether there is:
Confounding – one factor is merely a marker for the true prognostic factor, but does not predict prognosis independently
A combination of two or more variables interacting so that their combined effect is larger than the sum of their individual effects
Whilst it is not necessary to understand the complex mathematical models involved in multivariate analysis, it is important to be able to consider whether the researchers have taken into account all of the potentially important prognostic factors before drawing conclusions, and whether they have performed and reported a multivariate analysis.
Results
Results can be reported as a single rate or as a survival curve. The 5-year survival rate is the proportion of patients surviving 5 years from some point in the course of their disease. However, what happened during those 5 years? To determine this, a survival curve can be used.
A survival curve involves examining the probability of a person surviving each day with the disease and plots it on a graph, with vertical axis "proportion of cases" and horizontal axis "time." The proportion of cases refers to the proportion of patients "at risk" (i.e. still alive, not dropped out) at the beginning of that day who will survive till the end of the day. When interpreting survival curves you need to consider that:
As people die, the number of people remaining at risk decreases, and hence the estimates of probability become less accurate towards the right-side of the curve
This can also lead to an apparent plateau effect on the right-hand tail of the curve
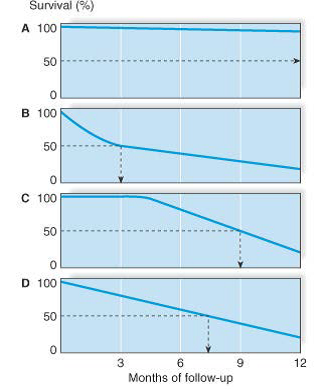
The following four survival curves show:
A. Good prognosis
B. Poor prognosis early, but slower increase in mortality, with median survival of 3 months
C. Good prognosis early, then worsening, with median survival of 9 months
D. Steady prognosis, with median survival 7.5 months
Results can also be reported as hazard ratios. These are similar to relative risk, however take into account time-to-event – the rate at which people are dying. For example:
2000 people are assessed in January – 1000 drink caffeine and 1000 do not.
10 of the caffeine drinkers die, giving a hazard rate of 10/1000 = 0.01
5 of the non-caffeine drinkers die, giving a hazard rate of 5/1000 = 0.005
Therefore, the hazard ratio is 2 (0.01/0.005), which means that twice as many patients died in the caffeine-drinking group during this time period
The remaining people are assessed in February. Of the remaining, 990 drink caffeine and 995 do not.
100 of the caffeine drinkers die, giving a hazard rate of 100/990 = 0.101
100 of the non-caffeine drinkers die, giving a hazard rate of 100/995 = 0.1005
Therefore, the hazard ratio is 1.005 (0.101/0.1005), which means that an almost equal number of patients died in both groups during the time period
The relative risk for this study would be:
110 of the caffeine-drinkers died, giving a risk of 110/1000 = 0.11
105 of the non-caffeine drinkers died, giving a risk of 105/1000 = 0.105
Therefore, the relative risk would be 1.05 (0.11/0.105), indicating almost no increase in risk
From the above, we can see that a hazard ratio represents instantaneous risk of a particular time-period of the study, whilst relative risk represents the cumulative risk over the entire study.
Critical Appraisal
When critically appraising studies of prognosis, we need to consider:
Are the results of the study valid?
Was the sample of patients representative?
Were the patients sufficiently homogeneous with respect to prognostic risk?
Was follow-up sufficiently complete?
Were outcome criteria objective and unbiased?
What are the results?
How likely are the outcomes over time?
How precise are the estimates of likelihood?
How can I apply the results to patient care?
Were the study patients and their management similar to those in my practice?
Was follow-up sufficiently long?
Can I use the results in the management of patients in my practice?
TASK (In lieu of quiz)
You are a general practitioner. A colleague calls you at home one night to ask you to see a relative of hers the following day. She has just seen her aunt and made a clinical diagnosis of herpes zoster, but feels it would be inappropriate for her to manage the problem herself. The patient is a 56-year-old woman who has previously been well. She has had 4 days of pain on the left chest wall in a T6 dermatome distribution. In the last 48 hours, she has noticed an erythematous maculopapular rash (in the same area), which has now become vesicular. She feels otherwise well and is on no regular medication.
You agree to see her the following morning. You are aware that antiviral treatment is recommended for the treatment of herpes zoster in patients seen within 72 hours of the onset of vesicles. Studies suggest that some antivirals may reduce the duration of postherpetic neuralgia. In your experience, however, severe and persistent pain following herpes zoster is not common in patients younger than 60 and antiviral therapy is relatively costly. You decide to see if you can find out more information on the likelihood of developing postherpetic neuralgia in patients who present with herpes zoster in general practice.
You conduct a search of MEDLINE and identify the following article:
Helgason S, Petursson G, Gudmundsson S, et al. Prevalence of postherpetic neuralgia after a first episode of herpes zoster: prospective study with long term follow up. BMJ 2000;321:794-796.
Task
Please critically appraise this article using the following critical appraisal template.
Are the results of the study valid?
Was the sample of patients representative?
Were the patients sufficiently homogeneous with respect to prognostic risk?
Was follow-up sufficiently complete?
Were outcome criteria objective and unbiased?
What are the results?
How likely are the outcomes over time?
How precise are the estimates of likelihood?
How can I apply the results to patient care?
Were the study patients and their management similar to those in my practice?
Was follow-up sufficiently long?
Can I use the results in the management of patients in my practice?